
Choosing the Right Widget for Your Report
Reporting's widget picker only offers chart types that make sense for whatever question or comparison you've selected, which narrows things down. But even the narrowed list can leave you choosing between three or four reasonable-looking options. This is a quick guide to picking the one that actually communicates your finding, rather than just the one that looks most interesting.
Single-Question Results
Bar or column is the default for a reason. It's the fastest chart type for a reader to interpret correctly, and it's rarely the wrong choice for a single question with a handful of answer options. Reach for something else only when you have a specific reason to.
Doughnut or polar area work when you want to emphasize "share of the whole" rather than compare individual option sizes precisely. A satisfaction breakdown where the story is "most people land in these two buckets" is a good example. They get harder to read past five or six answer options.
Line is for anything with a time or sequence dimension: a tracking question repeated across waves, or a Combined Survey comparison across survey instances over time. Using a line chart for a single point-in-time result usually just adds visual noise.
Comparisons
Cross-tab widgets (grouped bar or a grid) are the right call any time the finding is "how does this differ by segment," not just "what's the overall number." See Cross-Tabs and Combined Survey Analysis for more on setting these up.
Waterfall is for showing how a total breaks down into contributing pieces, or how a metric moved step by step from one state to another. It's useful for a small, specific set of comparisons rather than as a general-purpose chart type.
Treemap works when you have many categories of very different sizes and want the size difference itself to be the visual story. A large number of open-ended categories from Text Analytics is a common case, where a treemap makes the two or three dominant themes obvious at a glance in a way a long bar chart doesn't.
Section-Specific Widgets
A few widget types are only available for specific question or section types, because they're built around data those sections uniquely produce:
- Pairwise Comparison widgets summarize head-to-head results from a Pairwise Comparison section.
- Route Flow and Route Network are specific to a Sequence Flow section's ranking question. See Reading Sequence Flow Results: Consensus Routes vs. Averaged Rank for how to read them and when to use each.
- Click Heatmap is specific to a First-Click Test section. It overlays every respondent's click on your stimulus image, colored by click order, with your drawn target zones shown as outlines for comparison. See Reading Click Heatmap Results for how to interpret it.
- Shelf Test results use a standard picks chart with the section's images shown as a gallery above it. Each image card carries its label, and the enlarged view also shows the average tap order (labelled "Avg. tap order"). See Reading Shelf Test Results for how to read them.
These won't appear in the widget picker for a question that isn't the right type, so you don't need to worry about picking one by mistake.
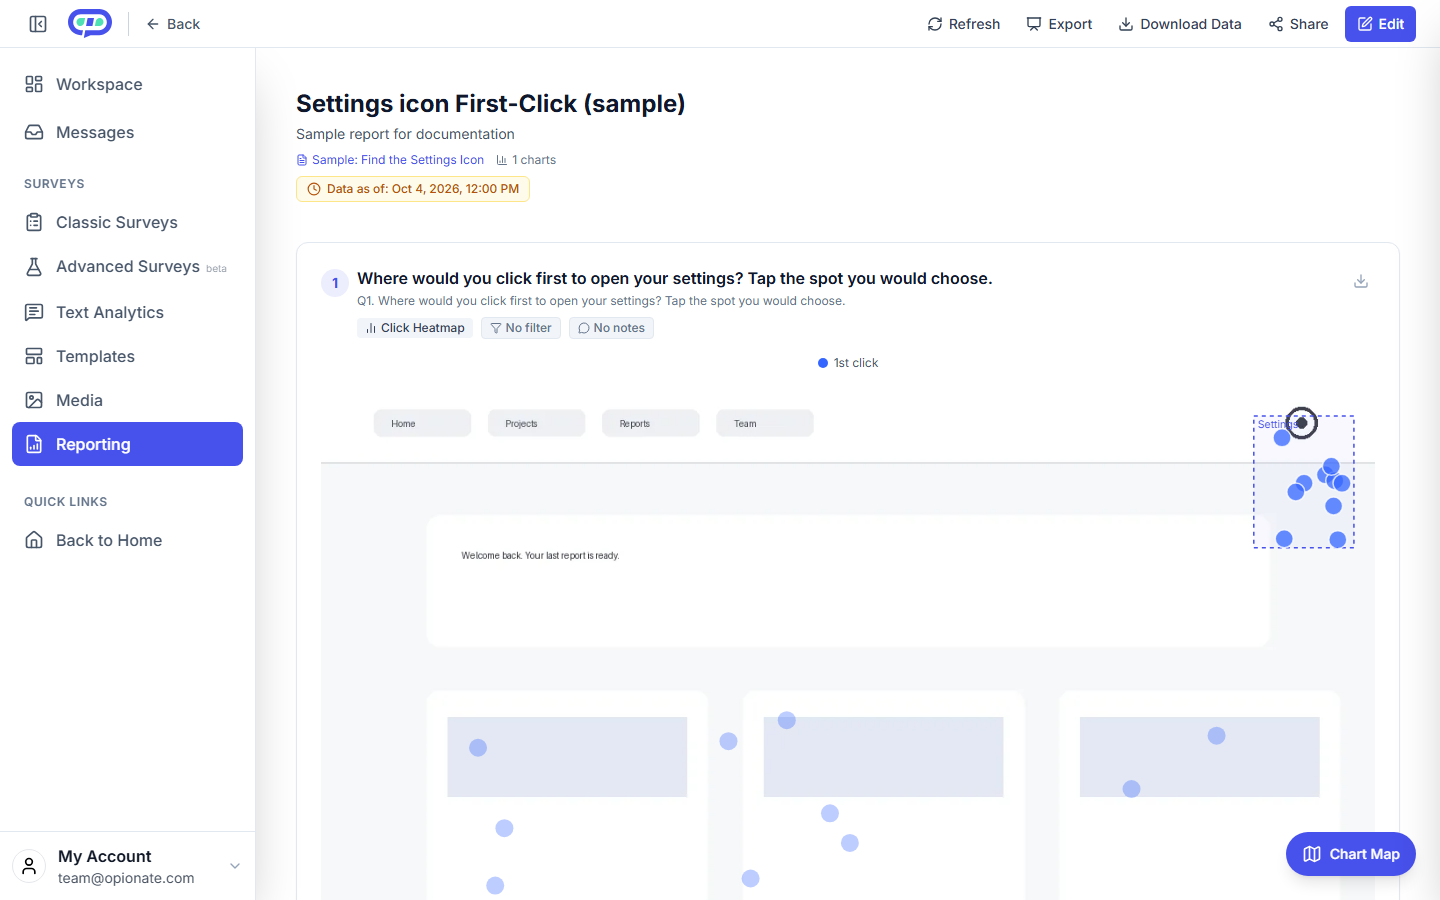
Click Heatmap, from 20 synthetic clicks. The dashed outline is the target zone. This is sample data, not real research.
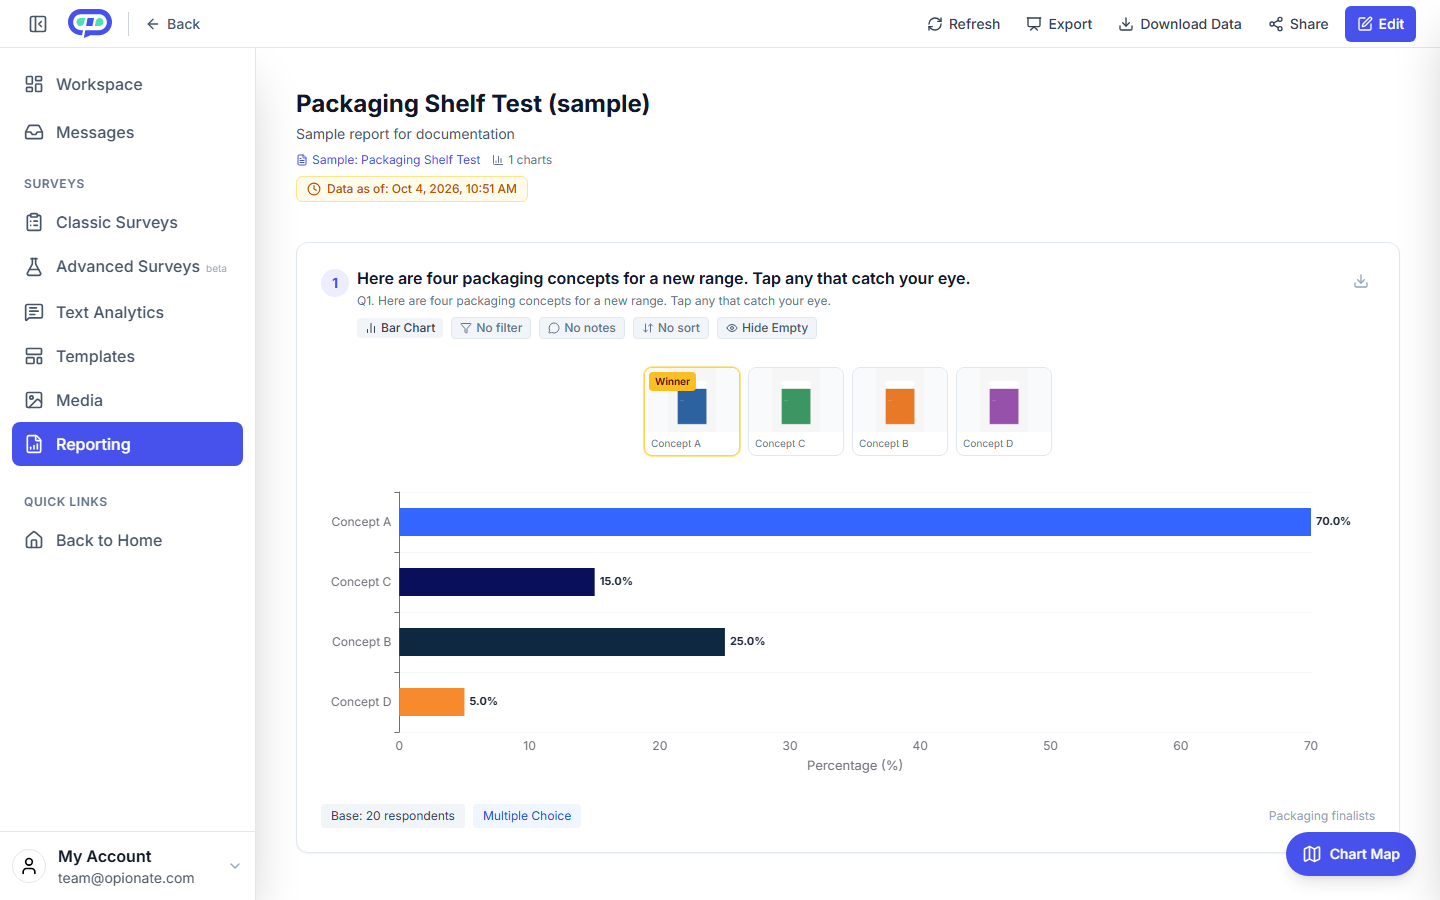
Shelf Test results: the picks chart with the section's images above it, from 20 synthetic responses. This is sample data, not real research.
A Simple Default
If you're not sure, start with bar or column for individual questions and a cross-tab for any comparison. Get the report's structure right, and swap in a more specialized chart type afterward only where it genuinely clarifies the finding. It's easier to upgrade one widget later than to untangle a report where every chart is trying to look distinctive.
FAQ
Can I change a widget's chart type after creating it?
Yes. Editing a widget lets you switch chart type without rebuilding the underlying data selection, as long as the new type supports the data you've selected.
Why don't I see Route Flow, Route Network, or Click Heatmap as options for my question?
Those chart types are only available for the specific section type they're built for: Route Flow and Route Network for a Sequence Flow section's ranking question, and Click Heatmap for a First-Click Test section. They won't appear for other question types.
Is there a "best" chart type for presenting to leadership?
Bar, column, and cross-tab widgets tend to read fastest for an audience seeing the data cold. That matters more in a live presentation than in a report you expect people to study closely on their own.
Next: once your report has the right widgets, see Exporting Your Report to PowerPoint to turn it into a deck, or Sharing a Report Publicly to send a live link instead.