
A category breakdown on its own - pricing 34%, support 28%, onboarding 19% - is closer to a table of contents than a finding. It tells a reader what people talked about; it doesn't yet tell them who talked about it, what specifically they said, or what to actually do about it. The gap between a clean classification result and a report someone acts on is entirely in what happens next: crossing the categories against the segments that matter, choosing quotes that earn the reader's trust rather than just decorating a slide, and being honest about the method behind the numbers so a skeptical reader doesn't have to just take the percentages on faith.
Table of Contents
- A Category Breakdown Alone Is a Weak Finding
- Cross-Tabulate Before You Present
- Choosing Quotes That Earn Trust
- Document the Method, Briefly
- Structuring the Actual Report
- A Worked Example
- FAQ
Category Breakdown
A weak finding alone - "34% mentioned pricing" says little on its own.
Cross-Tabulated
Against a real segment - the comparison is usually the actual finding.
Grounded in Quotes
Real language that earns trust in the number behind it.
A Category Breakdown Alone Is a Weak Finding
"34% of responses mentioned pricing" answers a narrow question and immediately raises three more: is that concentrated in one customer segment or spread evenly, is it getting better or worse over time, and what, specifically, are people saying about pricing beyond the fact that they mentioned it. A report that stops at the category breakdown leaves all three questions for the reader to ask out loud in the meeting, which is a worse outcome than answering them proactively in the report itself - not because the classification was wrong, but because a single percentage is rarely the actual decision-relevant finding on its own.
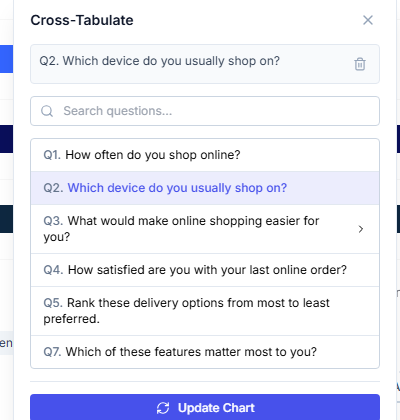
Cross-tabulating a theme against a segment - usually where the actual finding lives.
Cross-Tabulate Before You Present
The single highest-leverage step between a raw classification and a genuinely useful report is crossing your categories against whatever segments actually matter to the decision at hand - plan tier, tenure, region, department - using the same discipline covered in our guide on cross-tabulating survey data. A pricing complaint rate that's roughly even across every customer segment tells a different, more sweeping story than one that's heavily concentrated in customers on a single specific plan, and the second version points toward a much more targeted, cheaper fix than the first. This is almost always worth doing before a category breakdown goes in front of anyone, since it's the step most likely to turn a vague, company-wide-sounding finding into a specific, addressable one - and it's exactly the kind of question a sharp stakeholder will ask if you don't answer it first.
Choosing Quotes That Earn Trust
A percentage convinces a reader that something is common; a well-chosen quote convinces them it's real and specific. The temptation is to reach for the most vivid, most dramatic quote available - and vivid isn't always representative, which risks the same vocal-minority distortion covered in our guide on cognitive biases in survey analysis. A more trustworthy approach is choosing one or two quotes that are genuinely typical of the category - ordinary, unremarkable phrasing that a reader would recognize as representative rather than as an outlier being used to make the finding sound more dramatic than the aggregate data actually supports - alongside, if it exists, one more specific or unusual quote clearly labeled as an illustrative example rather than the norm. Pulling quotes directly from the classified dataset, rather than from memory or a handful of comments someone happened to notice while reading casually, keeps the selection tied to what the data actually shows rather than to whichever comment happened to stick in someone's mind.
Document the Method, Briefly
A short methodology note - how many responses were classified, whether categories were AI-suggested or manually defined, roughly what share of results were spot-checked or reviewed - costs a paragraph and buys a meaningful amount of credibility with a skeptical reader, particularly one who already has questions about how much to trust AI-assisted analysis in general. This doesn't need to be an academic-grade methods section; a sentence or two at the bottom of the report, or in an appendix, along the lines of "responses were AI-classified into these categories and reviewed for accuracy on the lowest-confidence 10%" gives a reader enough to calibrate their trust appropriately, and signals that the analysis wasn't treated as a black box even by the people who produced it.
Structuring the Actual Report
A report built from AI-categorized feedback tends to land better structured in a specific order: lead with the headline breakdown (the categories and their sizes), follow immediately with the cross-tabulated version that shows where the finding is concentrated rather than evenly spread, support the top one or two findings with a representative quote each, and close with what's actually being proposed or decided as a result - the same "then what" discipline that makes any survey finding worth reading, covered in our guide on writing survey reports people act on. A report that stops at "here's what people said" without a closing recommendation puts the burden of deciding what to do back on the reader, which is exactly the gap a good report is supposed to close.
A Worked Example
A B2B software company classifies 420 renewal-survey comments and finds "implementation complexity" as an unexpectedly large category at 31%. Rather than reporting that number alone, the analyst cross-tabulates it against account size and finds it's heavily concentrated among small-business accounts (48% of their comments) versus enterprise accounts (9%) - a sharp, specific split the blended overall number entirely hid. Reading the classified small-business responses, two representative quotes are pulled - both ordinary, unremarkable complaints about needing IT support they don't have in-house, not a single dramatic outlier standing in for the whole group. The final report leads with the cross-tabulated finding rather than the flat 31%, includes both quotes with a one-line methodology note on how the classification was built and reviewed, and closes with a specific recommendation: a simplified, IT-free setup path aimed specifically at small-business accounts, rather than a vague company-wide "reduce implementation complexity" initiative the unsegmented number alone would have implied.
FAQ
How many quotes should a report include per category?
One or two representative quotes per major finding is usually enough - more than that starts to feel like padding rather than evidence, and a long list of similar quotes doesn't add much beyond what the first couple already established.
Should I include quotes that contradict my main finding?
If a meaningful minority view exists within a category, briefly acknowledging it is more credible than presenting the category as perfectly uniform - a report that only ever shows quotes supporting its own conclusion reads as curated rather than analyzed.
How detailed does the methodology note need to be?
A sentence or two is usually sufficient for an internal business report - response count, whether categories were AI-suggested or manually defined, and whether results were reviewed. Higher-stakes or externally-facing reports may warrant more, closer to the documentation covered in our guide on AI vs. manual coding.
Is cross-tabulation always necessary, or only for the top finding?
It's most valuable for whichever findings are actually going to drive a decision - cross-tabulating every category regardless of relevance adds work without adding much value. Prioritize the categories that are large, surprising, or already under consideration for action.
For the full workflow this builds on, see How to Cross-Tabulate Survey Data and Writing Survey Reports People Act On.